Analytics Overview for Growth Automation Programs
The Analytics Overview offered with SaaSquatch's Growth Automation programs helps you gain more insight into the combined activity of your many varied programs and their participants.
To get started, select Analytics in the top navigation bar of your SaaSquatch administration portal. You should be taken to a sub-page labelled [Overview]. For program specific analytics, see our guide on Understanding Your Program Analytics Data.
🔗 All-Time Statistics
The metrics shown in this section provide you with a historical overview of all of your active programs with SaaSquatch. These metrics are broken down into three categories:
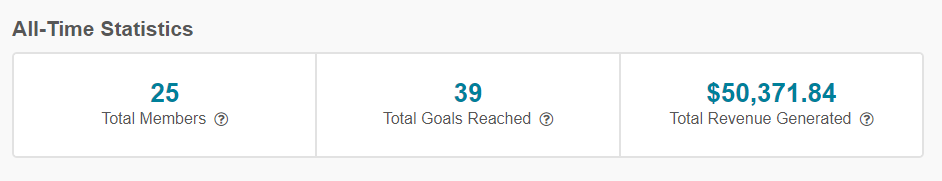
🔗 Total Members
This metric displays the total number of participants that have taken action towards any of your active programs. This valuable metric helps you see how many participants are actively making use of all of your programs.
🔗 Total Goals
This metric displays the total number of times a specific goal was reached in any of your SaaSquatch programs since introduction of goals on May 16th, 2019.
Definition
A goal is the desired customer action for each program, such as when a customer makes a purchase over a certain amount in a VIP program, or when a referred customer makes a qualified purchase.This metric is a key indicator of the success of a program. A rise in goals means your program is encouraging users to complete the desired action. A lack of growth, or a decline, means you should consider promoting your program, adjusting your goals, or test out different program rules.
🔗 Total Revenue Generated
This metric shows the total amount of revenue generated by any and all of your SaaSquatch programs, including those that are not currently active. In general, this is a summation of the purchases attributed to your loyalty programs.
This key metric is designed to provide you with a transparent view of the value generated by these programs. You can use this to determine your activity rates, program performance and ROI.
🔗 All Programs Overview
The graphs in this section are designed to provide you with additional insights for a specific timeframe. You can adjust this timeframe by using the dropdown menu. You can also compare that time period with the period before it by using the 'Compare to Previous Dates' checkbox beside the dropdown.
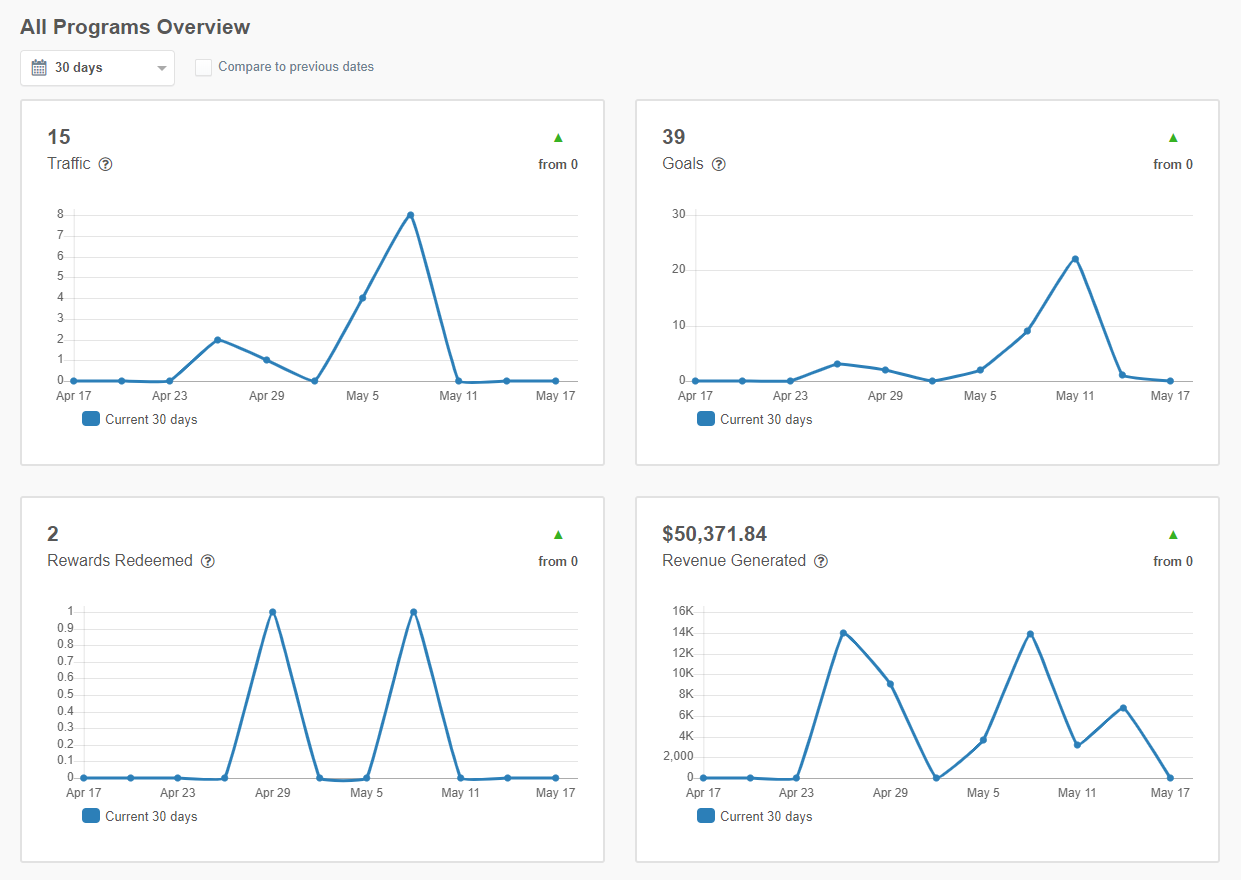
🔗 Traffic
Here you can view the total number of times someone has clicked on a sharelink for any of your programs spread across the selected time period. This is a good indicator of organic traffic that is being generated to your site or service via your programs.
Note: If you are not using sharelinks in any of your programs, this chart will not display any data. In such a case, we recommend referring to the 'Total Members' and 'Goals' graphs for accurate program data.
🔗 Goals
This graph shows the number of times a goal was achieved across all of your programs spread over the selected time period.
This metric helps you gauge the overall health of your programs. An increasing trend in goals shows greater adoption and general success of the program whereas a decreasing trend could indicate a need to increase visibility of the program, a change in marketing strategy or reviewing the structure of the program itself.
Note: Calculation and tracking of goals is a new feature that is being rolled out as part of this new Analytics page. As a result, there is no measurement of goals from before May 16th, 2019.
🔗 Rewards Redeemed
This graph shows the total count of rewards redeemed by participants in all of your programs for the selected time period.
This metric allows you to quickly review how many rewards your programs are paying out to participants. It is also useful in assessing the success of your program, and whether or not the chosen reward(s) structure is maximizing incentive without impacting profit.
🔗 Revenue Generated
This graph shows all of the revenue generated by all of your SaaSquatch programs across the selected time period.
This is an important metric for determining the success of your programs over time, especially when compared against the previous period. A negative trend indicates that your program could use some attention. If you are not sure what is causing this decline in program activity we recommend reaching out to your account manager for a program review call.
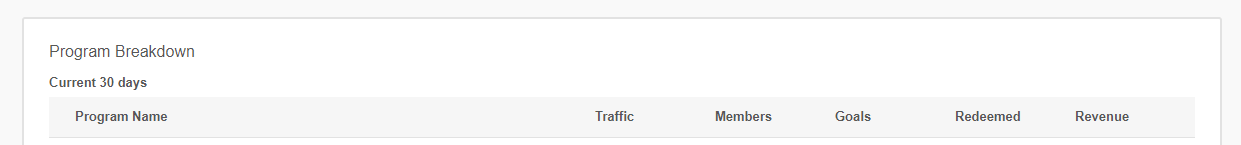
🔗 Program Breakdown
This section shows the key analytics metrics broken down by individual programs, based on the selected timeframe. These numbers mirror the graphs above but are broken down into each individual program. As it is possible for a participant or member to partake in more than one of your programs, it should be noted that the 'member' numbers may not add up to perfectly match the corresponding graph above.
🔗 Analytics and You
The data provided to you on this page offers great insight into your programs, their health and their past performance. From this dataset, you can confidently ascertain the cost of these programs to your business, the benefit they are providing, as well as any positive or negative trends that require further investigation.
As always, if you have questions, concerns or feedback about this page, our Success team is always happy to hear from you!