Understanding Your Program Analytics Data
Learn about the different types of Analytics data that are available, and how to use this data to improve your referral programs.
The SaaSquatch platform provides access to a wide range of information about your referral program and its participants. Most of this information is easily accessible through your SaaSquatch Portal’s Analytics page. By understanding what the data means, and leveraging the insights, you can find opportunities to improve your referral program performance.
🔗 Referral Statistics
The Referral Statistics section provides a look at the Referrer and Referred User Funnels within your referral program lifecycle.
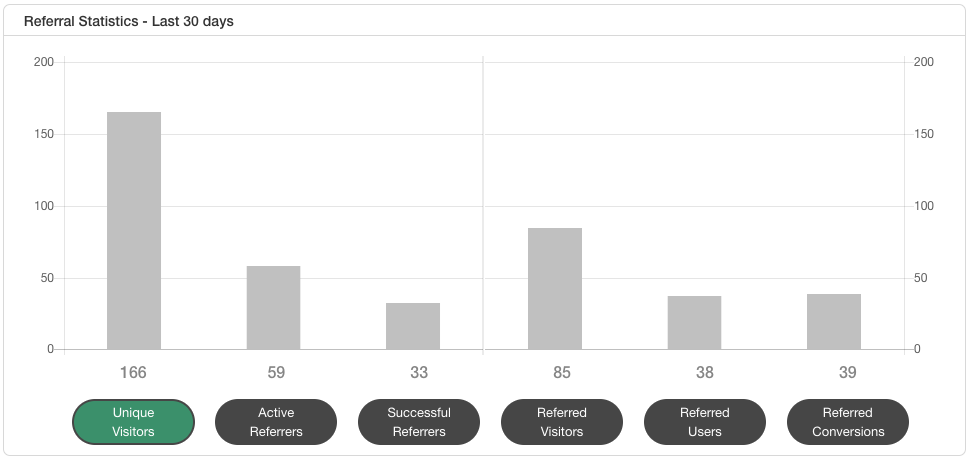
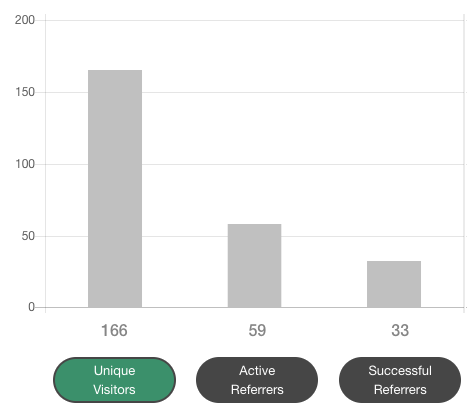
🔗 Referrer Funnel
- Unique Visitors - How many people were exposed to your referral program through the Referral Widget in your platform.
- Active Referrers - How many of those people shared out their referral.
- Successful Referrers - How many were successful at getting a Referred User to complete their end of the referral process.
🔗 What does this data tell me?
The Unique Visitors information provides a look at how many people were exposed to your referral program through the Referral Widget in your platform. This information can help identify where to increase the visibility of your referral program in your product. Increasing the visibility of your referral program in your product can expose the offer to more of your existing customers, leading to more referrals being shared out.
Secondly, the Referrer Funnel provides valuable information about the filtering between each of the Referrer’s steps in the referral flow. Varying success in the each of the stages of the funnel can help you understand which are doing well, and which you would like to focus on for improvement. What you might find is that your referral program is seeing lots of exposure (Unique Visitors), and many people are sharing out the referral offer with their friends (Active Referrers), but that you would like to increase the number of people who are successful at enticing a Referred User to convert (Successful Referrers).
Finally, the Referral Success Rate value at the top of the Referrer Funnel lets you know what percentage of your existing users who were exposed to your referral program managed to successfully complete a referral. This metric can be used as part of a high-level look at the overall health of your referral program.
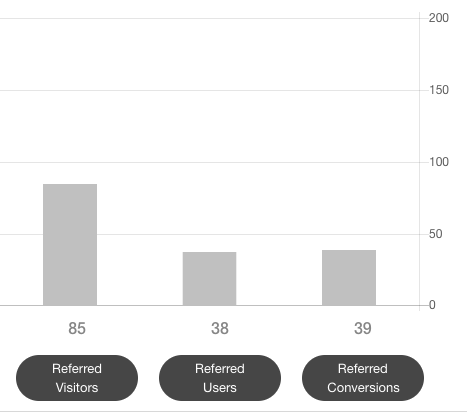
🔗 Referred User Funnel
- Referred Visitors - People who clicked on a share link.
- Referred Users - Unique referred users who have started the referral process, such as clicking on a referrer’s share link and signing up for your program
- Referred Conversions - Referred Users who ended up paying for your product.
🔗 What does this data tell me?
The first key piece of information in the Referred User Funnel is the number of Referred Visitors, or how many people clicked on a referral link and were redirected to your product.
The second important value to look at is the Conversion Rate percentage at the top of this section of the funnel. This value represents what percentage of people made if from clicking a referral link, all the way through to meeting your program's goalpost (e.g. paying for your product).
These two metrics together provide a good look at the health of your referral program.
With so many differences between businesses there is no one value for the Conversion Rate which indicates a healthy referral program. The most pragmatic approach to utilizing the numbers from your Conversion Rate is to look at how it changes over time. As you continue to run your referral program you should expect Referrers to bring in more higher quality leads. These Referred Users will in turn begin to make their own referrals. Both of these activities will compound over time and increase that Conversion Rate as you continue to run your referral program.
Very low or very high conversion rates may indicated a reward that is not well positioned, and either not compelling or too compelling to prospective customers, or other issues with the path to goalpost/purchase for incoming customers.
Example 1:
If you are finding that your Conversion Rate is very good, but you would like to increase the overall number of conversions you are seeing, then it may be a case of simply needing to entice more Referrers to share the referral offer among their friends. This will drive traffic (Referred Visitors) at the top of the Referred User Funnel, which will filter down to more conversions.
Example 2:
You might be finding that many people are driving a good amount of traffic to your site through your referral program (Referred Visitors), but would like to increase the number who are signing up and then paying (Conversion Rate).
In this situation you can look at:
- Making sure the messaging being shown to Referred Visitors enticing them to take advantage of the referral discount is clear.
- Ensuring that the reward being offered is persuasive enough for people to want to take advantage of it.
🔗 Additional Sections
The Referral SaaSquatch Analytics Portal provides a range of additional information about each of the Referral Funnel steps within the Program Overview section. Each of these additional sections is filtered by the highlighted Referral Funnel step.
e.g. When the Referred Visitors Funnel step is selected in the Program Overview section, the Engagement Medium graph is showing what Engagement Medium users who referred these Referred Visitors used to access the referral program.
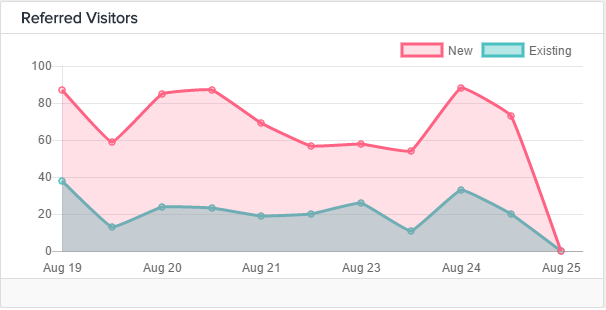
🔗 Timeline
The timeline metric displays the events from the selected stage in the referral funnel (e.g. Referred Conversions) at the point in the selected timeline (e.g. last 30 days) when they occured.
The 'New Users' vs. 'Returning Users' segmentation refers to whether or not the user connected with the event (e.g. the Successful Referrers, or the Referred Conversions) was registered within the timeframe being viewed (e.g. last 30 days). 'New Users' refers to them having been registered within that time window, and 'Returning Users' refers to those registered before that window.
🔗 Engagement Medium:
Note: This metric is only available for unique visitors, active referrers and referred visitors.
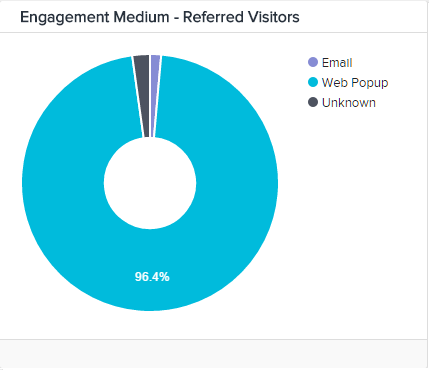
🔗 What does this data tell me?
The Engagement Medium statistic can be extremely helpful if you have your referral program visible in multiple areas of your product as it can help you identify what method of accessing your referral program is the most successful.
Example 1:
You might find that people are much more likely to share out a referral from the widget within your mobile app than within your web app.
This information can shed light on the user experience of your referral program in your web app vs. your mobile app and can help indicate differences in user experience across platforms. This can be useful when looking for user experience areas to improve in your product.
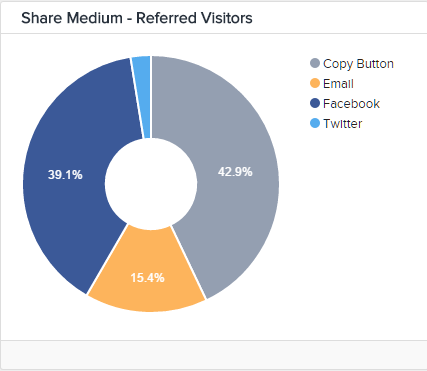
🔗 Share Medium:
Note: This metric is only available for unique visitors, active referrers and referred visitors.
🔗 How do I use this Analytics Information?
The information in this article is intended to help you make sense of the wide range of information that is available about your referral program.
Once you have an understanding of what your referral program’s data is telling you, you can use it to help make improvements and optimizations to your program.
Our article on Referral Marketing Channels will help you better understand the different ways that your users can interact with your referral program. You can also read more about the different options user have for sharing out their referral in our article on Customizing Your Referral Program.